
When you are writing .NET Lambda functions in combination with, e.g., Step Functions, it might be useful to see what is happening inside your lambda function.
What you don’t get, by default, is the input value that triggered your function. When you are working with .NET you can get this as well by setting the environment variable LAMBDA_NET_SERIALIZER_DEBUG=true
{
    "timestamp": "2024-11-02T10:56:03.954Z",
    "level": "Information",
    "requestId": "175aaa06-aa97-47df-a9d9-8d5e6a33b906",
    "traceId": "Root=1-67260543-06352a33432e2a704be1a0bf;Parent=69220d6d49275569;Sampled=0;Lineage=1:60e5321a:0",
    "message": "Lambda Deserialize System.String: {\"key1\":\"value1\",\"key2\":\"value2\",\"key3\":\"value3\"}"
}
In the message part, you can see what the Lambda serializer is going to serialize! This information can be extremely useful to see what is passed!
Digging deeper into the logs
You can get even more additional information when you tweak the lambda logging configuration (inside Monitor and configuration tools) to trace.
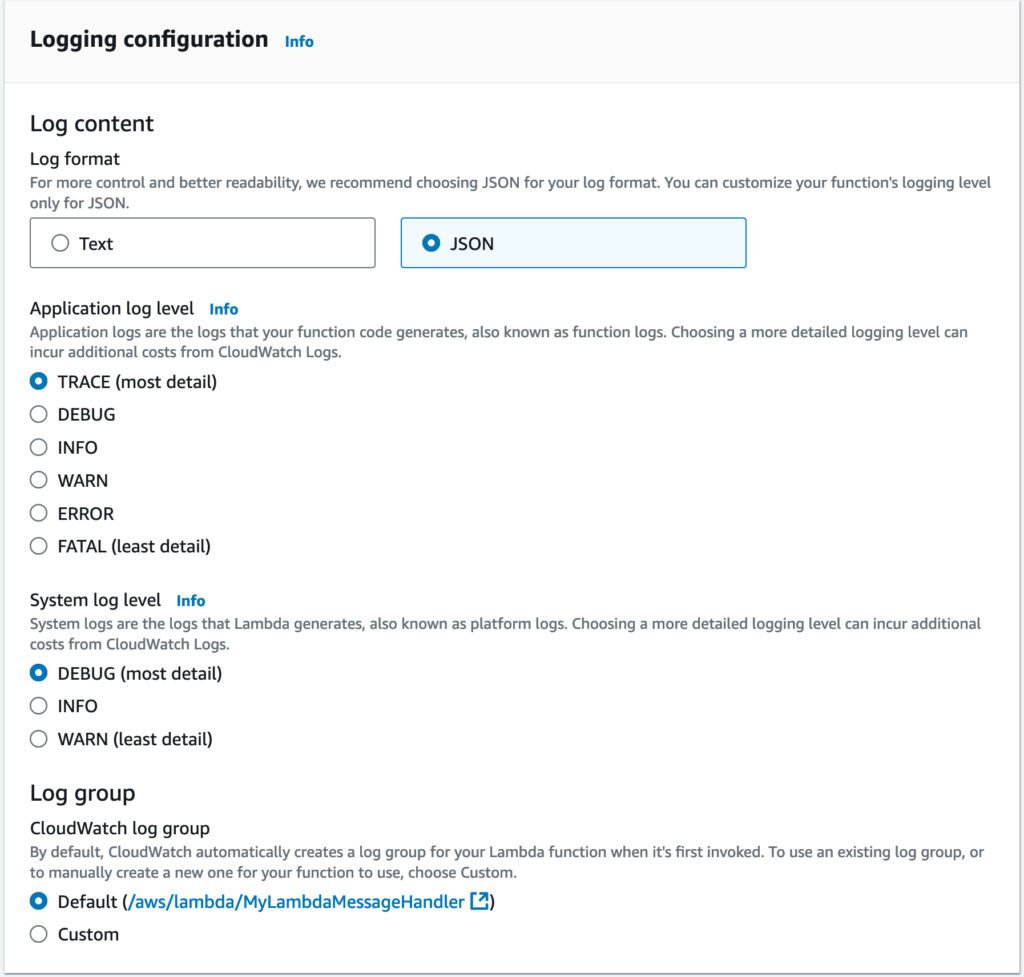
This gives you more information about the different phases your lambda goes through its lifecycle:
- initstart, initRuntimeDone, initReport, start, runtimeDone, report.
Below, you can find an example of the logging of the lifecycles:
InitStart
{
    "time": "2024-11-02T10:49:11.264Z",
    "type": "platform.initStart",
    "record": {
        "initializationType": "on-demand",
        "phase": "init",
        "runtimeVersion": "dotnet:8.v26",
        "runtimeVersionArn": "arn:aws:lambda:eu-west-1::runtime:44bcd21a5019cdb2a069cc3811f2c01b6c70a947718d9e03acc6030b6f454805",
        "functionName": "MyLambdaMessageHandler",
        "functionVersion": "$LATEST",
        "instanceId": "2024/11/02/MyLambdaMessageHandler[$LATEST]29881c8d13c2499c8a50ba9529341750",
        "instanceMaxMemory": 536870912
    }
}
initRuntimeDone
{
    "time": "2024-11-02T10:49:11.565Z",
    "type": "platform.initRuntimeDone",
    "record": {
        "initializationType": "on-demand",
        "phase": "init",
        "status": "success"
    }
}
initReport
{
    "time": "2024-11-02T10:49:11.565Z",
    "type": "platform.initReport",
    "record": {
        "initializationType": "on-demand",
        "phase": "init",
        "status": "success",
        "metrics": {
            "durationMs": 300.767
        }
    }
}
Start
{
    "time": "2024-11-02T10:49:11.569Z",
    "type": "platform.start",
    "record": {
        "requestId": "9dc646b4-4d03-42aa-92fe-512ea48b2d83",
        "version": "$LATEST"
    }
}
RuntimeDone
{
    "time": "2024-11-02T10:49:11.856Z",
    "type": "platform.runtimeDone",
    "record": {
        "requestId": "9dc646b4-4d03-42aa-92fe-512ea48b2d83",
        "status": "success",
        "metrics": {
            "durationMs": 286.909,
            "producedBytes": 0
        }
    }
}
Report
{
    "time": "2024-11-02T10:49:11.857Z",
    "type": "platform.report",
    "record": {
        "requestId": "9dc646b4-4d03-42aa-92fe-512ea48b2d83",
        "metrics": {
            "durationMs": 287.295,
            "billedDurationMs": 288,
            "memorySizeMB": 512,
            "maxMemoryUsedMB": 70,
            "initDurationMs": 301.932
        },
        "status": "success"
    }
}
That is it for today! I hope that these logs can give you more information about your lambda startups!